


Space news has a habit of sounding either impossibly technical or wildly overhyped. DESI has managed to dodge both. The Dark Energy Spectroscopic Instrument has now helped produce the largest 3D map of the universe ever assembled, and it did it ahead of schedule. Not bad for a project trying to chart reality itself.
The headline number is the kind that makes your brain briefly leave the room: 47 million galaxies and quasars mapped in three dimensions. That is not a typo, and it is not a modest upgrade on what came before. It is a giant cosmic filing system built from years of observations, turning distant points of light into a structure you can actually trace through space and time.
For readers interested in untold stories, this is one of those rare moments where the quiet scientific grind ends up being more dramatic than most blockbuster scripts. DESI is not just making a prettier star chart. It is helping researchers examine how the universe expanded, how matter clusters across unimaginable distances, and what dark energy might be doing behind the scenes while the rest of us are busy pretending we understand any of this after one coffee.
A map so big it borders on rude
DESI is based at Kitt Peak in Arizona and uses thousands of robotic fibre-optic positioners to gather light from galaxies and quasars across the night sky. In simple terms, it measures redshift to work out how far away those objects are, then builds a 3D view of the cosmos rather than a flat snapshot. That means scientists are not only seeing where galaxies sit, but also when in cosmic history they existed.
The scale is absurd in the best possible way. We are talking about billions of years of cosmic history and a map detailed enough to reveal the web-like structure of the universe, where galaxies gather along glowing filaments and leave enormous dark voids between them. It is less “sprinkling of stars” and more “the universe has been secretly running on infrastructure”.
Why DESI matters beyond the wow factor
The real point of all this is dark energy, the still-mysterious force believed to be driving the accelerating expansion of the universe. DESI’s data gives researchers a much sharper tool for measuring how that expansion has changed over time. That matters because cosmology is full of big claims resting on very hard measurements.
And DESI moved fast. The project reached this milestone ahead of schedule, which in science is almost as shocking as discovering a new planet in your back garden. The result is a richer dataset, more opportunities for cross-checking existing theories, and a clearer view of where current models may still be missing something important.
What the 3D universe actually looks like
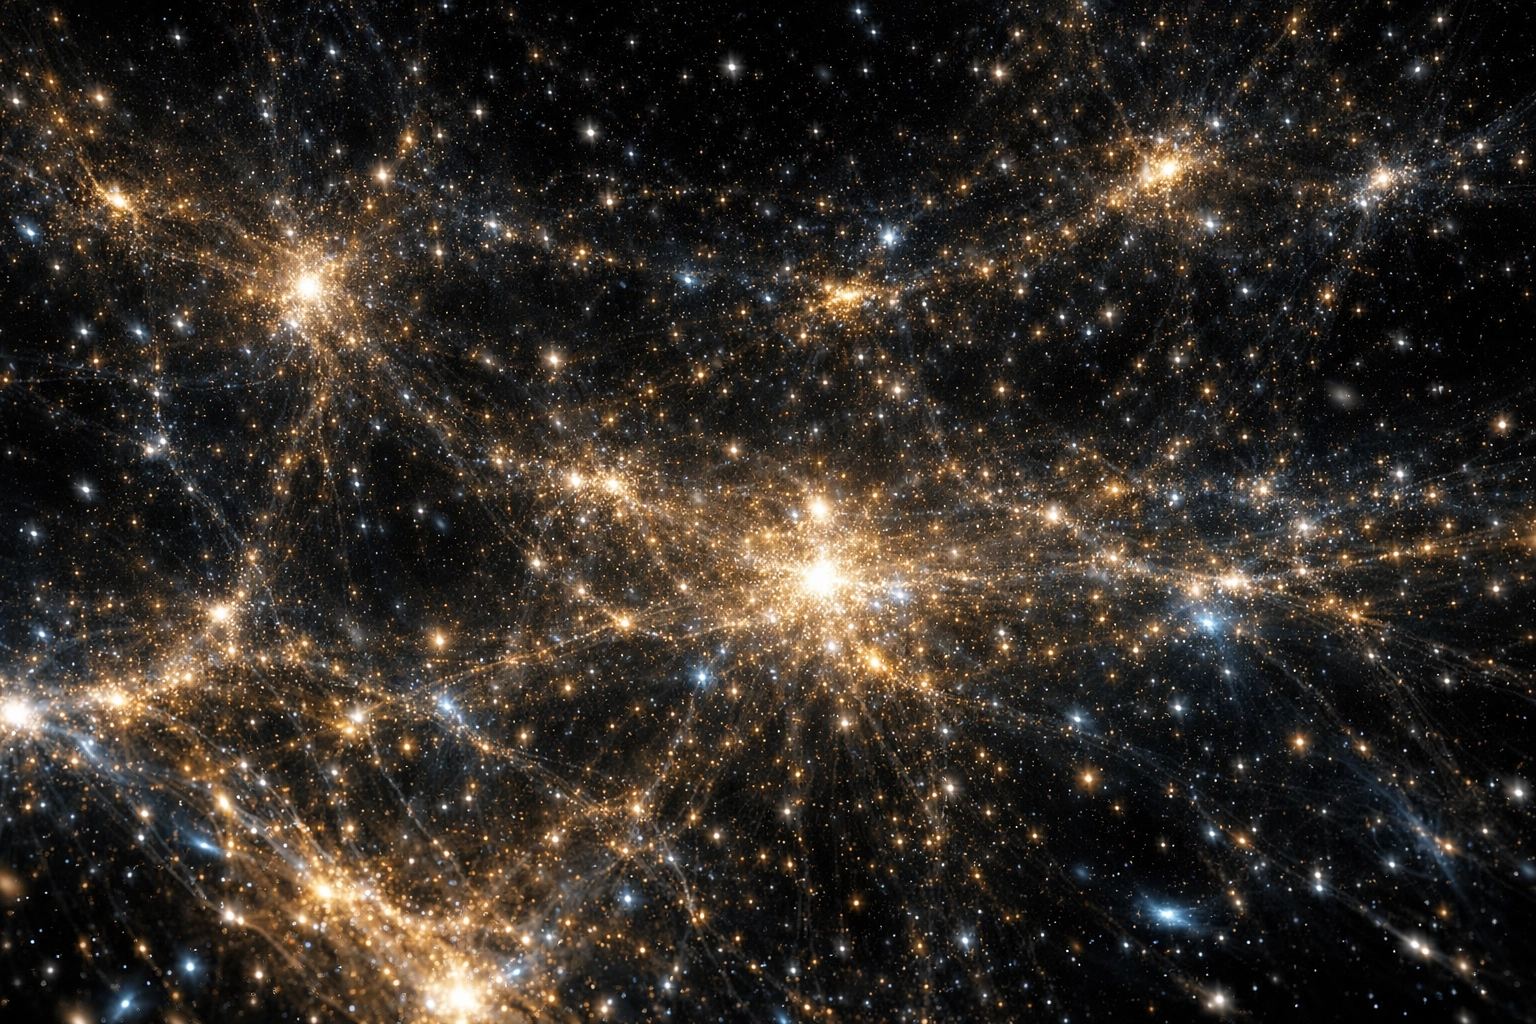
If you picture the map as a neat scatter of dots, think bigger and stranger. A proper 3D visualisation looks like an immense luminous network: clustered knots of galaxies, long branching filaments, and cavernous empty regions where very little lives at all. Colours can be used to show depth, with nearer galaxies in one range and more distant ones shifting into another, creating a layered view that feels part science, part existential crisis.
That visual power is part of why this story lands. DESI gives us a way to see the universe not as a flat ceiling of lights, but as a living structure with shape, history and motion. For a project built on patient observation, the result is surprisingly cinematic. It is also a reminder that some of the biggest untold stories are not hidden by secrecy, but by scale. The data is there. We just needed a better map.
The completion of this 3D map marks a major scientific milestone and a useful reality check. However noisy life on Earth becomes, the universe remains staggeringly large, deeply strange and still only partly understood.